When choosing which metal to use for a
specific application, physical properties such as strength, hardness, ductility
and toughness are often important. Toughness, defined as the ability to
withstand shock loading, is commonly determined by the Charpy test (ASTM E23).
This involves a pendulum breaking a standard specimen: the pendulum’s loss of
energy from before-impact to after-impact is the toughness measurement.
Toughness is a critical characteristic used by the
military to compare the impact performance of specimens of armor plate. It has
the potential to be similarly useful for comparing the expected behavior of
bullets cast from various lead-tin-antimony alloys when they strike animals.
Because I found little actual data on the toughness of these alloys, I decided
to investigate the matter experimentally. In most respects the Charpy test was
suitable for my experiments but I wanted to obtain a direct indication of
specimen ductility. While ductility can be inferred from the ‘instrumented’
Charpy test it is not indicated by the simple mechanical version, and the
instrumented version was beyond my intended scope. I therefore departed somewhat
from the Charpy concept and chose to deform my specimens by a standard amount
instead of just fracturing them. This still gave me a measurement of the
deformation-energy required, but also enabled me to grade specimens as ductile
if they deformed without cracking, intermediate if they cracked but retained
considerable strength, and brittle if they fractured before reaching the
standard amount of deformation.
| |
|
|
|
Picture 1 |
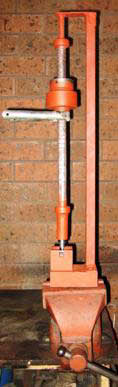
I developed a
simple drop test device, shown in the first photograph. The large cast iron
weight (partly-elevated and supported by a spring-clamp in the picture) is
raised a suitable distance up the graduated slide then released to fall and
strike the chisel, which rests against the side of a test specimen placed on an
interrupted V block. The specimen, V block and chisel are shown in more detail
in the picture #2.
 |
|
Picture 2 |
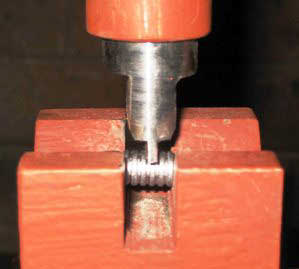
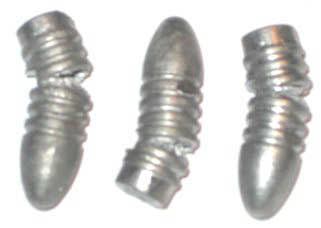
The specimens
were bullets cast in a Lyman 311466 mould: a standard commercial bullet mould
readily available to other experimenters, and which easily produces large
numbers of physically-identical cast specimens of suitable proportions for
testing. Consistent axial location of each specimen was achieved by resting the
shoulder at the end of the gas check rebate against the edge of the gap in the
supporting V-block. This gap was 10 mm wide. The chisel tip was flat and 2.5 mm
wide. The mass of the drop-weight could be varied between 1.5 and 6.5 kg (1.5
shown in photograph), and the drop-height could be varied from zero to 30 cm.
The toughness measurement was simply equal to the potential energy of the weight
when suspended at its drop-height, since all of this energy was subsequently
converted to kinetic energy then absorbed in deforming the specimen. The
effective anvil mass was maximized by clamping the test device in a large
industrial vice bolted to a 16 mm steel bench-top.
 |
|
Picture 3 |
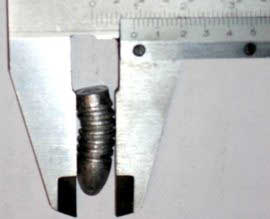
The standard amount of
deformation I applied is shown in the photograph at left (picture #3).
Drop-height and -mass were adjusted to give an 8.5 mm dimension across each
 |
|
Picture 4 |
specimen after deformation, unless
fracture occurred first. The specimen shown in the caliper was classified as
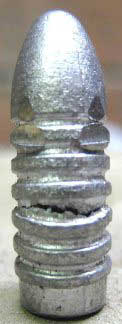
ductile. The second picture shows an intermediate specimen, which developed a
tensile crack directly opposite the chisel. The third picture shows some brittle
failures: when deformed to the 8.5 mm dimension the two parts were almost
separated, and could have been broken by finger pressure.
I investigated the
effects of three variables on alloy toughness: heat-treatment, percentage of
antimony, and having a low tin-to-antimony ratio versus equal amounts of tin and
antimony in the alloy. Heat-treatment consisted of holding a sample for one hour
at a selected temperature between 175 and 240 degrees Celsius, then
water-quenching.
 |
|
Picture 4 |
The first experiment involved a
wheel-weight alloy of about 0.2% tin and 2% antimony, remainder lead with a
minor amount of arsenic. The alloys will be described by their percentages of
tin and of antimony, so I will refer to this as 0.2/2 alloy. Physical analysis
was not available, so all alloys were identified indirectly by simultaneous use
of three methods: calculation based on their ingredients; the alloy’s liquidus
temperature; and the hardness of air-cooled samples. In the absence of physical
analysis, reported compositions should be considered approximate. All specimens
of each alloy were cast in a single batch from a single pot of alloy. For each
hardness level a sample comprising fifteen specimens was aged at ambient
temperature for two weeks after casting or heat-treating, before testing. Five
specimens from each sample were hardness-tested using a Lee tester, and as many
of the other ten specimens as necessary were impact-tested at various energy
levels until the required deformation measurement was achieved.
 |
|
Chart 1 |
 |
|
Chart 2 |
 |
|
Chart 3 |
 |
|
Chart 4 |
 |
|
Chart 5 |
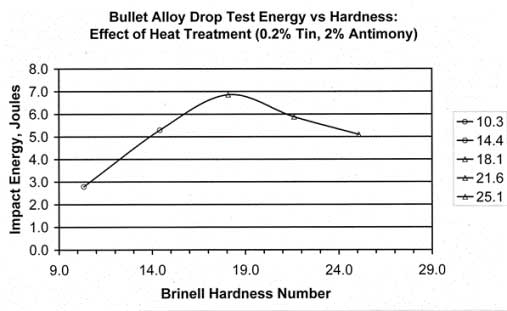
The
effect of heat-treatment on 0.2/2 alloy is shown by the chart at right (chart
1). In all of the charts that follow ductile results are shown as circles,
intermediate results as triangles, and brittle results as squares. The
lowest-hardness sample was always air-cooled and the highest-hardness sample was
as hard as I could make that alloy by simple oven heat-treatment and
water-quenching.
Toughness
initially increased with increasing hardness, but a peak was reached at about 19
BHN and beyond this hardness, toughness declined.
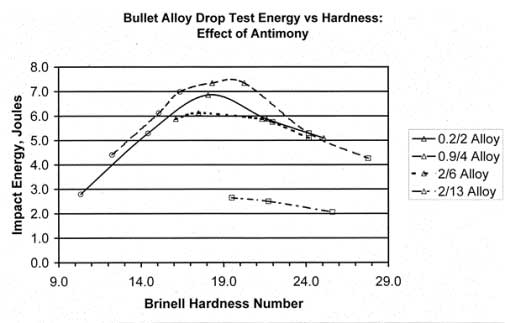
In the second
experiment four fairly commonplace low-tin bullet-casting alloys having
different antimony contents (0.2/2, 0.9/4, 2/6 and 2/13) were compared. Results
are shown on chart #2.
The greatest peak toughness, 7.5
*
Joules, was achieved by the 4% antimony alloy. Both 2% and 6% antimony alloys
had less peak toughness than this, and the 13% antimony alloy had little
toughness regardless of heat-treatment. In all cases peak toughness seemed to
occur at a hardness close to 19 BHN.
For the third experiment
three of the four low-tin alloys were compared with their pseudo-binary
equivalents. A pseudo-binary alloy of lead-tin-antimony has equal percentages of
tin and antimony. In such alloys substantially all of the tin and antimony are
expected to combine to form the compound Sb Sn, so the alloy effectively is
binary, or consists of only two substances: lead and Sb Sn (ignoring minor
amounts of arsenic that may be present). The well-known Lyman No. 2 alloy, which
would be called 5/5 under the notation used here, is pseudo-binary.
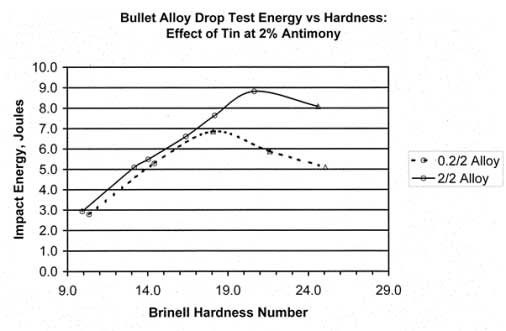
The first comparison
was between 0.2/2 and 2/2 alloys. Results are shown in chart #3.
Up to 17 BHN there was
little difference in the toughness of the two alloys. Above 17 BHN the
pseudo-binary alloy was both tougher and more ductile, reaching its toughness
peak of 9 Joules at about 21 BHN - slightly higher than the low-tin alloy’s 19
BHN.
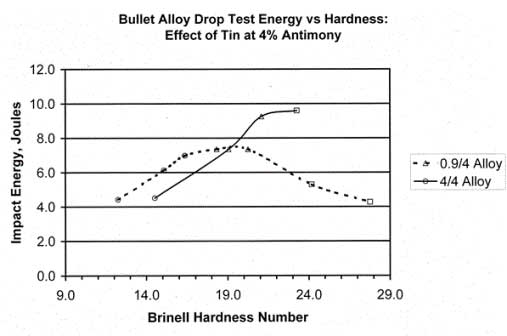
The second comparison was between 0.9/4 and 4/4 alloys.
Results are shown on chart #4.
Once again the
pseudo-binary alloy’s peak toughness was greater at 9.6 Joules, and was reached
at a higher hardness (23 BHN) – the peak hardness achievable for this alloy.
There were insufficient data points to determine whether there was a difference
in ductility between the low-tin and pseudo-binary alloys.
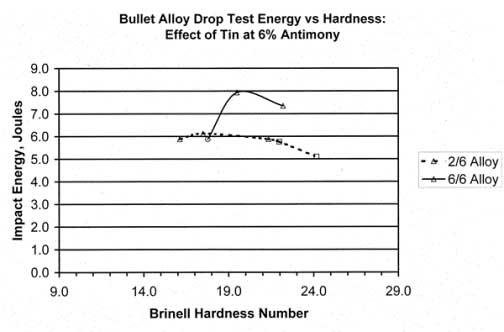
The third comparison
was between 2/6 and 6/6 alloys. Results are shown on this chart.
As in both previous instances, the pseudo-binary alloy reached greater peak
toughness (8 Joules) than the low-tin alloy but this time did so at only
slightly higher hardness (20 BHN). As with the 4% antimony alloys, the
pseudo-binary alloy’s peak hardness was lower. The pseudo-binary alloy was the
more ductile of the two.
Six main observations can be made
from these results. First, appropriate heat treatment enhanced the toughness of
all alloys tested except 2/13, which even when air-cooled was at the 19 BHN
optimum hardness for maximizing toughness. (The toughness enhancement from heat
treating the next-highest-antimony low-tin alloy, 2/6, was very small.) Second,
an optimum antimony content for maximizing peak toughness seemed to exist at
somewhere around 4% antimony for both low-tin and pseudo-binary alloys. Third,
every pseudo-binary alloy tested demonstrated substantially (26-29%) greater
peak toughness than a low-tin alloy with the same antimony content. Fourth, the
pseudo-binary alloys may have been more ductile than the low-tin alloys. Fifth,
increasing the antimony content may have decreased the ductility of the alloys.
Sixth, each alloy’s ductility may have been decreased by heat treatment. More
data would be required to confirm the last three of these points.
If the fifth and sixth observations are valid, greater
hardness, whether it is attained by antimony content or heat-treatment, comes at
the price of reduced ductility. However the data suggest that ductility can be
increased by increasing the tin content, up to the point where tin and antimony
contents are equal.
This report makes use
of both theoretical and empirical information from F. D. Weaver, “Type Metal
Alloys”, Journal of the Institute of Metals Vol. LVI No. 1, 1935, pages 209-240.
|
-
Geoff Chamberlain |
| |
|
*American
Heritage Dictionary |
| joule |
(Pronunciation - jōōl,
joul) |
|
| n.
Abbr.
J or j |
|
1. The
International System unit of electrical, mechanical, and thermal energy.
|
|
2. |
a. A unit of electrical energy equal to
the work done when a current of one ampere is passed through |
| a
resistance of one ohm for one second. |
|
b.
A unit of energy equal to the work done when a force of one newton acts
through a distance of one meter. |
|